Implied volatility calculation
Today we’re going to talk about how we calculate volatility in Option Workshop, and what our plans are to improve this part of the functionality.
Option Workshop is integrated with several data sources, which provides market data for options and their underlyings. They all are different, with a different API, different architecture, but they all have one thing in common – they don’t provide current implied volatility value for options. This means we have to figure it out on our side, inside the Option Workshop pricing mechanism.
Available data
We have several option contract parameters which we can utilize to figure out implied volatility (IV) These are:
- Last trade price or settlement;
- Best bid price;
- Best offer price.
Also we utilize the last price of an underlying contract or asset.
The problem
First, let’s formulate a basic approach and then consider its limitations and ways to handle them.
The IV of an option contract can be calculated as the IV of its midmarket price – a half of a sum of the best bid and best offer prices.
The approach is clear and easy. But it works only if the following conditions are true:
- There are both bid and offer for an option;
- The spread between the bid and the offer isn’t too wide;
- A midmarket price is higher than an option’s intrinsic value.
These conditions seem simple, but actually they are far away from always to true. If we take a look at an option, which is deep in or out of the money, then any of these condition might be violated.
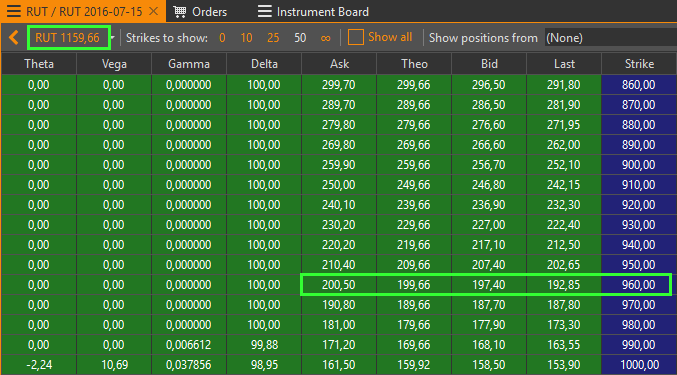
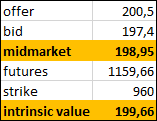
Let’s consider a Russell 2000 July series. The current futures price is 1159.66, the best orders for the 960 (deep in the money) call are 200.5/197.4. The midmarket price is 198.95, while the intrinsic value of a 960 call is 199.66, that means the “market” is below the option payoff function at expiration.
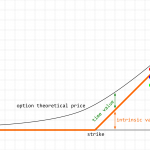
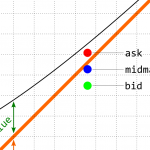
Look at the figure titled Option price, payoff function and best orders. The orange line is the call option’s intrinsic value. The black line – it’s current theoretical price. The red and green dots are the best ask and bid, and the blue one is half the sum of the red and green – the midmarket price. Normally, for actively traded options that are near the money, all dots must be above the orange line and in some relation with black line: ideally, if the model and the market fit each other, then the black line will be between the red and green dots.
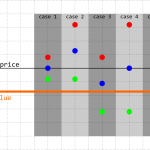
Figure Possible spreads illustrates six scenarios of how the best orders may appear in an order book.
Case 1 is clear and simple. The spread between orders is tight and its center can be treated as a fair market price. You can buy and sell with a small price difference, so it means that the fair price is somewhere in between.
Cases 2, 3 and 4 are the same in common. Spreads between the bid and offer are too wide and despite the fact that the market price is somewhere within this spread, it’s impossible to figure out its value. In other words we can’t use the half sum of the best orders as a representative value of the price.
Cases 5 and 6 are the worst. Because they are lacking either a bid or an offer, there can be no midmarket at all.
How we handle it now
Right now we do it not in a way in which we want and going to do soon. At the moment we only apply some empirics to pull off an adequate value from the prices we have.
If the spread is too wide or doesn’t exist we take the last price or settlements, if the datasource provides it.
If the spread is tight but its mean is below the option’s intrinsic value, then we take the last and add 0.1% to it.
This all is a compromise and we’re currently working on making something completely different.
What users will get soon
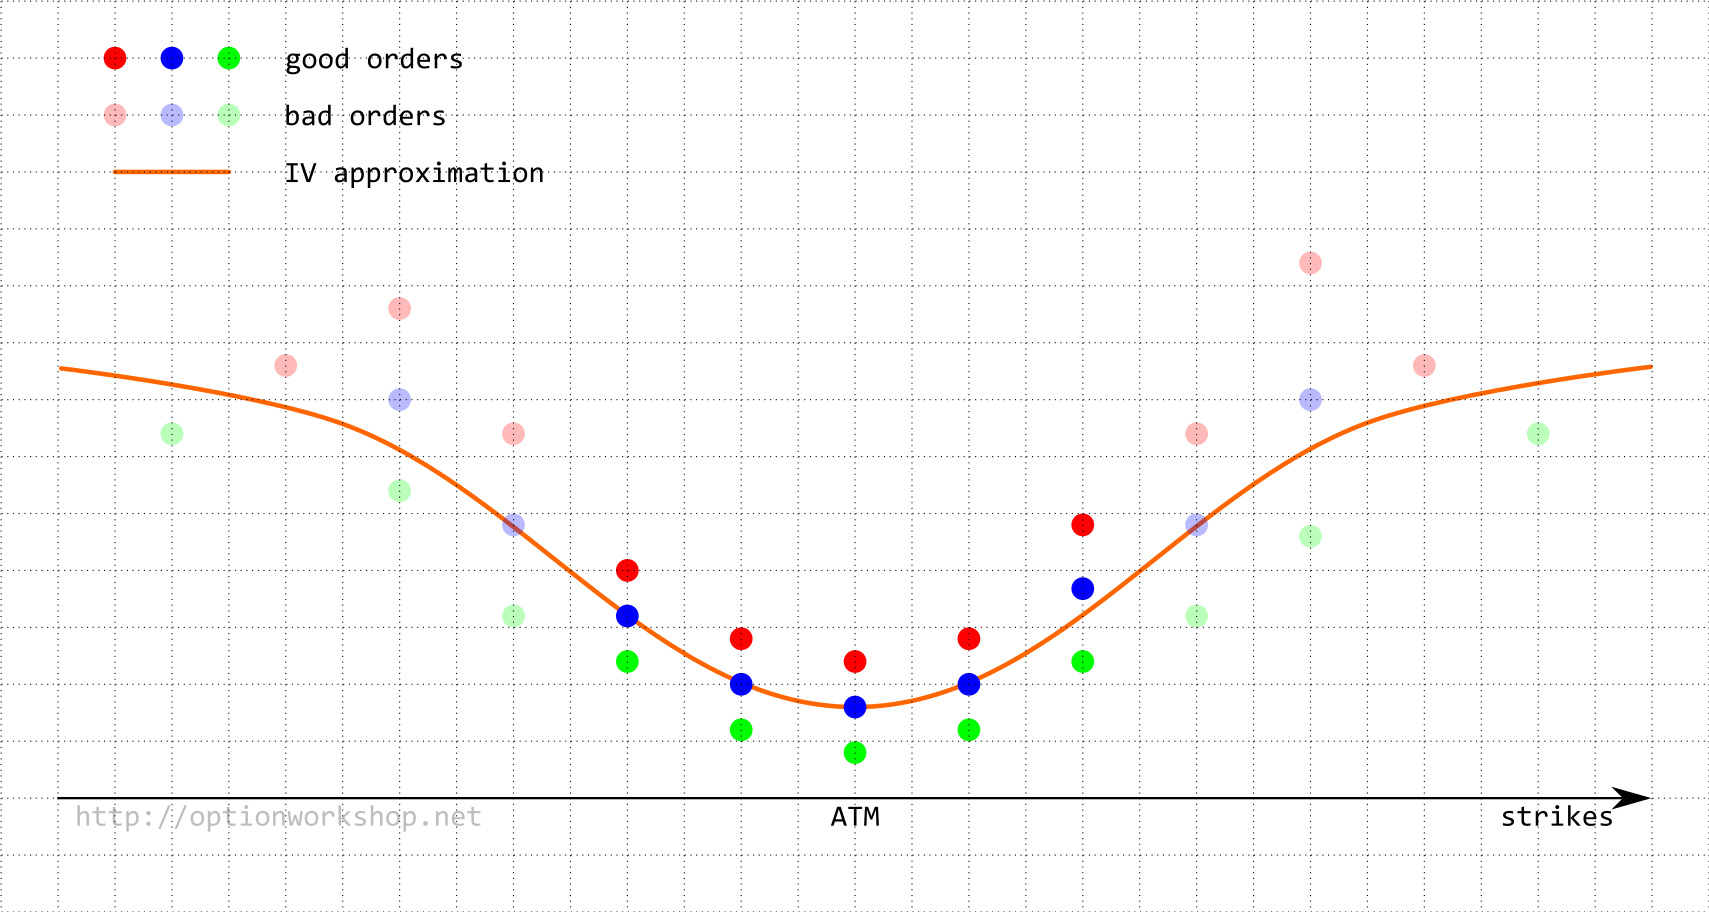
We are working now on developing a logic of IV curve approximation. It means that based on the strikes, which are liquid enough and where the spreads are tight, we will build up a curve for the whole strikes grid. It’s not an easy thing, there are a lot of assumptions and mathematics. But when this functionality will be rolled out, users will get good enough default volatility curves and the ability to manipulate it with model parameters.
We hope you will enjoy it.