Release 16.4.812
A lot of things have been done in this update! The new version can already be downloaded from the website or through the update system.
New charting
We’ve replaced the library which we were using for charting. The previous version had serious performance limitations and we were unable to implement some of the features that we wanted. With the new charting system, we’ll now be able to add these additional features in.
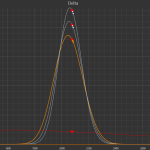
At the moment, users have the same charting functionality, but it is now more efficient, faster and more accurate. Let’s take a look at a couple of examples:
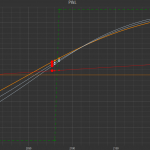 ]
]
We’ve revamped the way that users can manipulate charts. It hasn’t yet been described in the documentation, but it’s important, so as of this version, the charting manipulation techniques are as follows:
- Mouse wheel – move the chart horizontally
- Ctrl + mouse wheel – zoom in & out
- Shift + mouse wheel – move the chart vertically
- Right mouse button – zoom into the selected region
- Left mouse double click – reset to 100% view.
Also now we save the Price range settings between program launches. Before, users had complained that it was cumbersome to restore the price range every time.
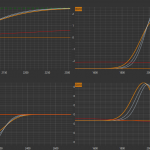
There are now ten times as many nodes in the grid which is used to build the chart, so they are now 10 times as precise.
TeamViewer as a remote support system
Before we used Ammyy Admin – it was a nice piece of software, but unfortunately most antiviruses assumed that it was dangerous. From the perspective of view of an average user, that meant that our software was dangerous, since their executable was inside our distributive.
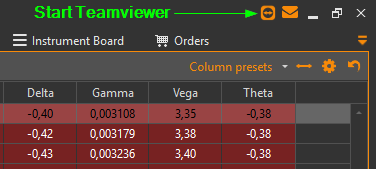
Now, if you need our support team to help you directly through your computer, press the button in the top right corner. It will launch the TeamViewer quick support executable and our agent will be able to see your monitor (following approval).
CQG demo generation
Now user can generate a CQG Continuum demo login directly through the software, without asking our support team. This will decrease the time barrier needed to get new users experiencing our software with live data.
New columns in the positions table
- Last price – the last traded price of the instrument
- P&L (M) – profit/loss as shown in currency, rather than in the contracts’ quote points
- Bid/Offer – for individual positions these columns show the best prices for corresponding contracts. For a summary row it shows the bid and offer for the whole strategy.
Options desks
- New column – Last price
- Reusing last used columns settings when opening new desk
- Open option desk menu item in a context menu for instrument and position
Instruments tree
The format for the futures codes has now been changed.
Permalink