Modelling a naked call position
Small intro about how-tos
We often hear the rebuke that our documentation is much too dry and much too technical. With this blog we’re going to breath in some personality into our public material. We’ll do this by examining some concrete use examples and describing how to solve them using our software. All posts of this kind will be registered in the how-to category, so it will be easy to filter them.
Preconditions
Below we describe how to play with some very basic options positions modelling. We assume that the user has already setup the software with at least one datasource. We’ve created several videos describing integration with external systems, if you’re interested, you can find them here.
Modelling a single position
One options trading mentor had a very simple reply to the question “How to start trading options”:
– Just buy a call and see what will happen
So you want to follow this advice, but without opening a real position. Maybe even without having a real account. It means that all you need is to create a virtual position at the current market price and with the desired number of contracts and then monitor it as the market changes.
Adding an account
This step is optional, because in most cases after connecting OptionWorkshop to some datasource it will pull trading accounts and automatically add them to the list. But if, for example, the user connected the software to IQ Feed – a pure market data source, without execution – then it’ll be necessary to create an account. Another reason to create a virtual (test, modelling) account is just to separate modelling options positions from real ones.
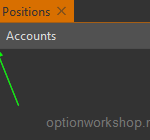
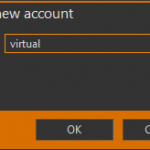
To add virtual account in the Positions form press the cross button above the accounts list. The form for entering a new account name appears, there we have to fill in the Name field as shown on the second form. Now press Ok and see that account was added and appears in the list.
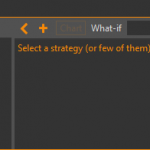
Strategy
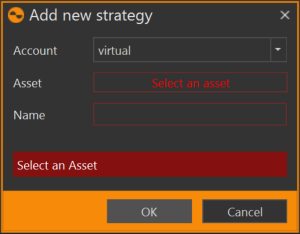
Now let’s add a strategy. Press the button with a cross icon that’s above the strategies list (see Fig. 2), that will bring the form on the lift. The Account field will be pre-filled out if before clicking the add strategy button you’ve selected an account in the list. The only thing you’ll need to do is to select a base asset and type in the new strategy name. Remember that the name must be unique within an account and base asset subportfolio. When the form has been filled out, press Ok. The new strategy will be added.
In the next post we will talk about strategies in more details, for now let’s just consider that our strategy is just a subportfolio, in which we place some positions.
Position
There are three ways to add a modelling position into strategy and the aim of this post is to describe them all:
- The “Add position” button;
- Drag&drop instrument from the options desk to the positions table;
- Drag&drop instrument from the instrument tree to the positions table.
“Add position” button
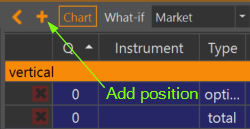
Above the positions table there is a button with a cross icon, showed on the picture on the left. Clicking this button brings the “Add a new position” form and users only need to fill in the form fields, which are the instrument, the position price and the quantity. Remember, the quantity can be negative, that means the position will be a short position.
“Drag&drop” from options desk
This is the most convenient way to add new positions.
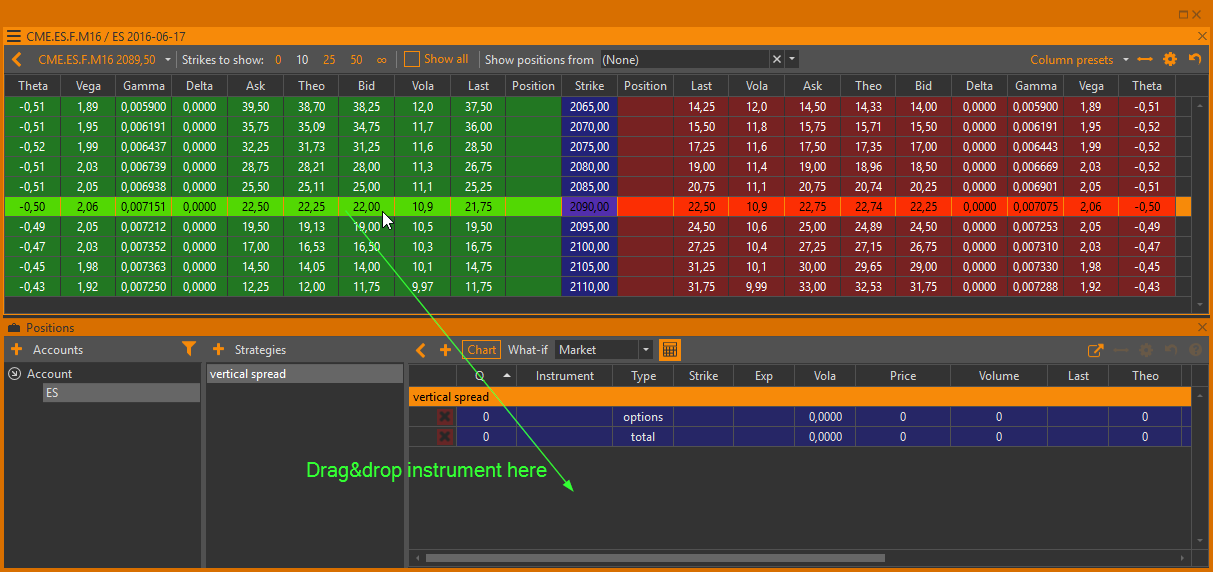
From the options desk you can drag&drop any option into the positions table, and this action will also open the “Add new position” dialog. Dragging the left (green) part of a row will add a call, the right (red) – will add a put.
Note, that “Add new position” will be prefilled as much as possible: account, instrument, strategy and price will all have predifined values when the form opens. The price field will be prefilled with a value depending on which cell you started dragging from. If we start dragging the “bid” cell, then the price will be taken from the bid.
“Drag&drop” from instruments tree
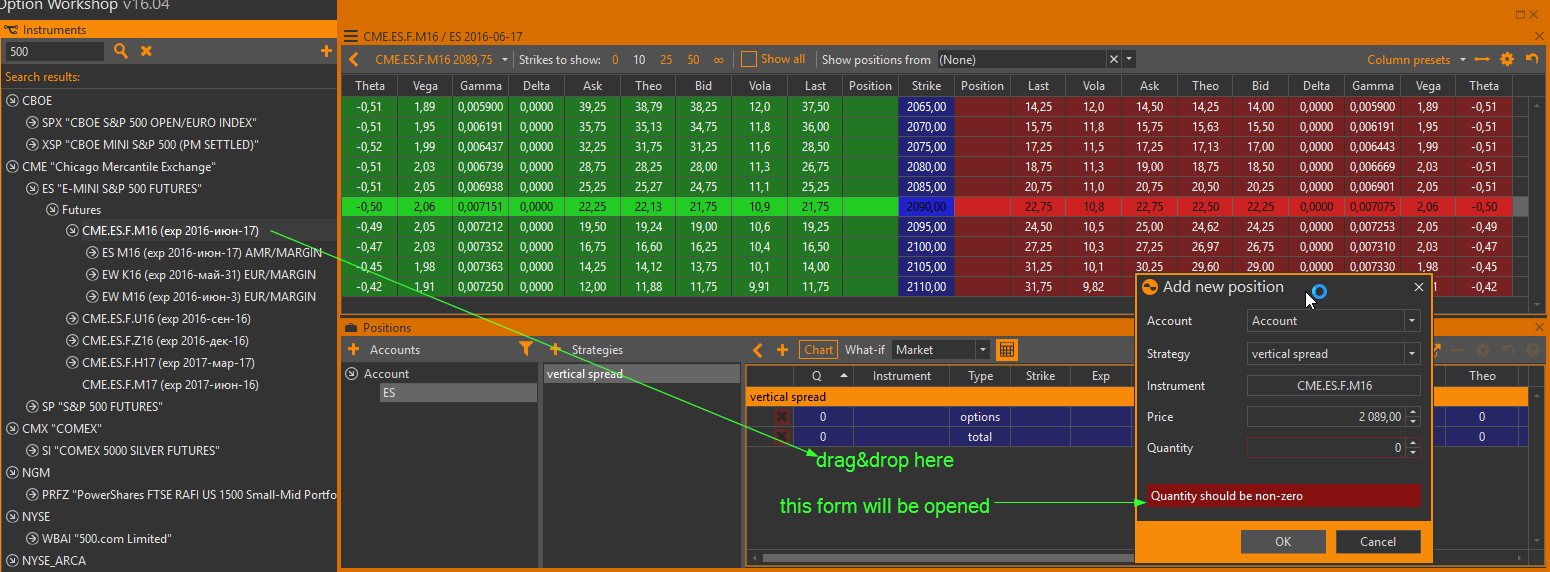
Simply drag the instrument from the instruments tree onto the positions table. It works exactly the same as the previous two methods.
Chart
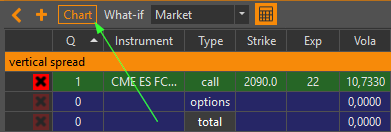
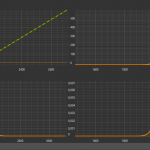
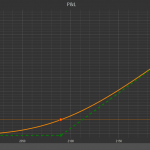
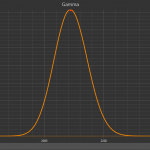
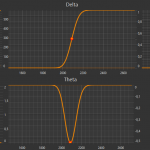
Now that the position is added, we can build a risk profile and visualize the greeks. The Chart button above the positions table opens a new window with all the strategy parameter graphs.
Permalink